Increasing uncertainty with regard to the severity and frequency of catastrophic events is challenging the P&C insurance industry to revisit existing catastrophic risk management and loss adjustment strategies by improving the overall understanding of all natural hazards. Traditional methods for viewing and analyzing risk have evolved—leaving behind, for some companies, inefficient legacy systems.
With 6 continents, 100+ countries/territories, and 185+ models, CoreLogic has the breadth, depth, and granularity to get you the data you need, enabling you to stand with us at the forefront of next-level catastrophe modeling.
With country peril models spanning 90% of the world’s GDP, CoreLogic can provide the analysis of your data your way—be it API, on-premise, cloud-enabled, and beyond.
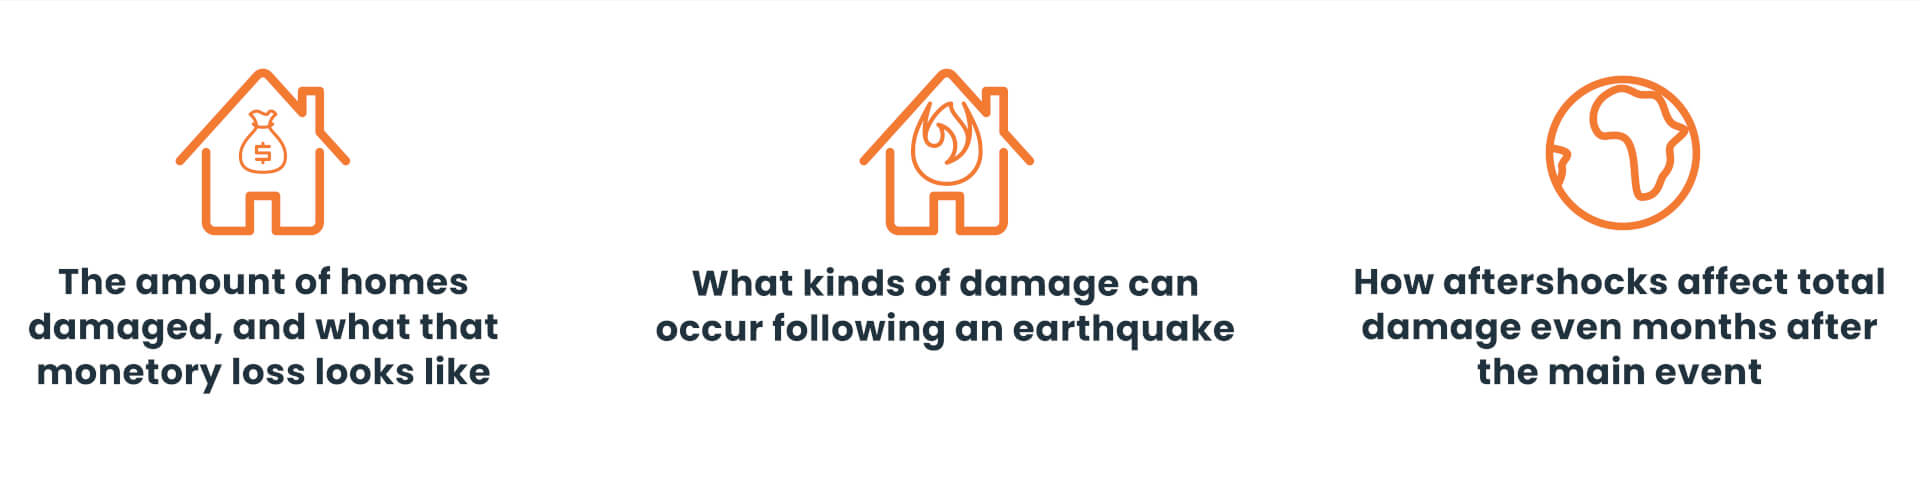
Damage caused by earthquakes can be catastrophic and has both a human and financial impact. Earthquakes cause ground motion and displacement of the earth’s surface, resulting in damage to the built environment, including buildings and their contents.
Our earthquake models include:
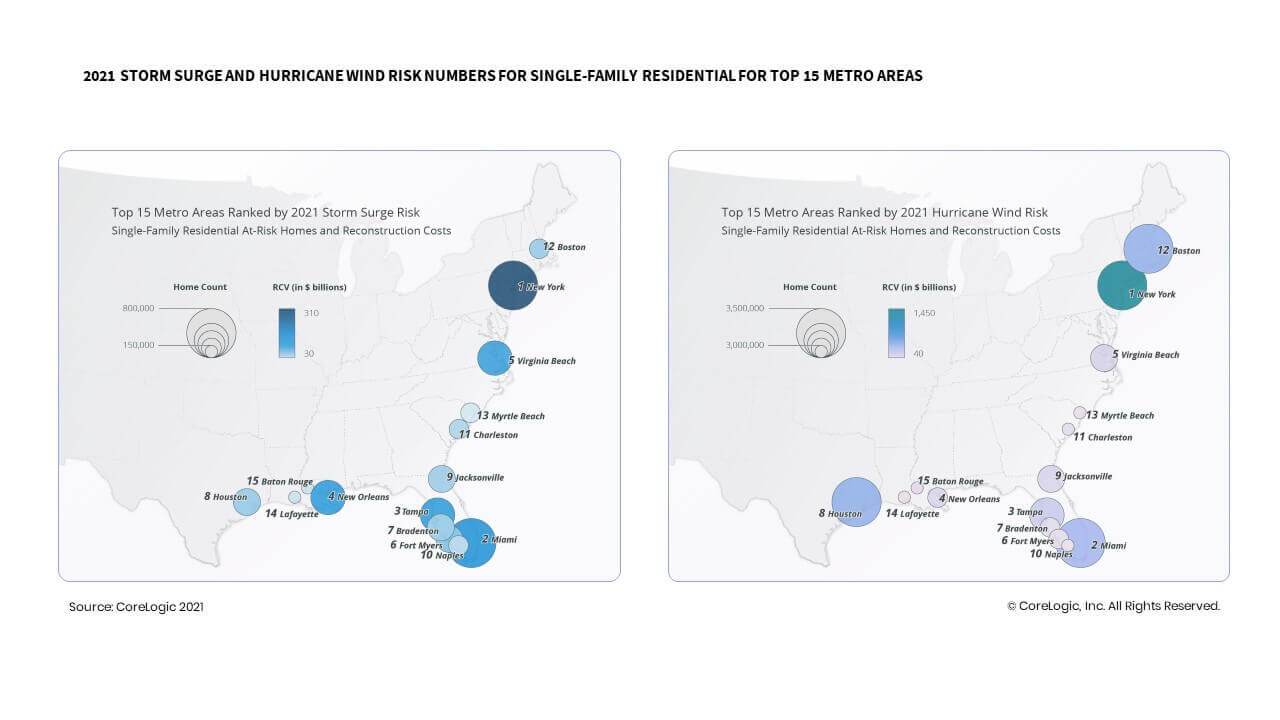
The significant damage potential from tropical cyclones presents challenges to risk managers when quantifying potential losses to their books of business.
Our cyclone models include:
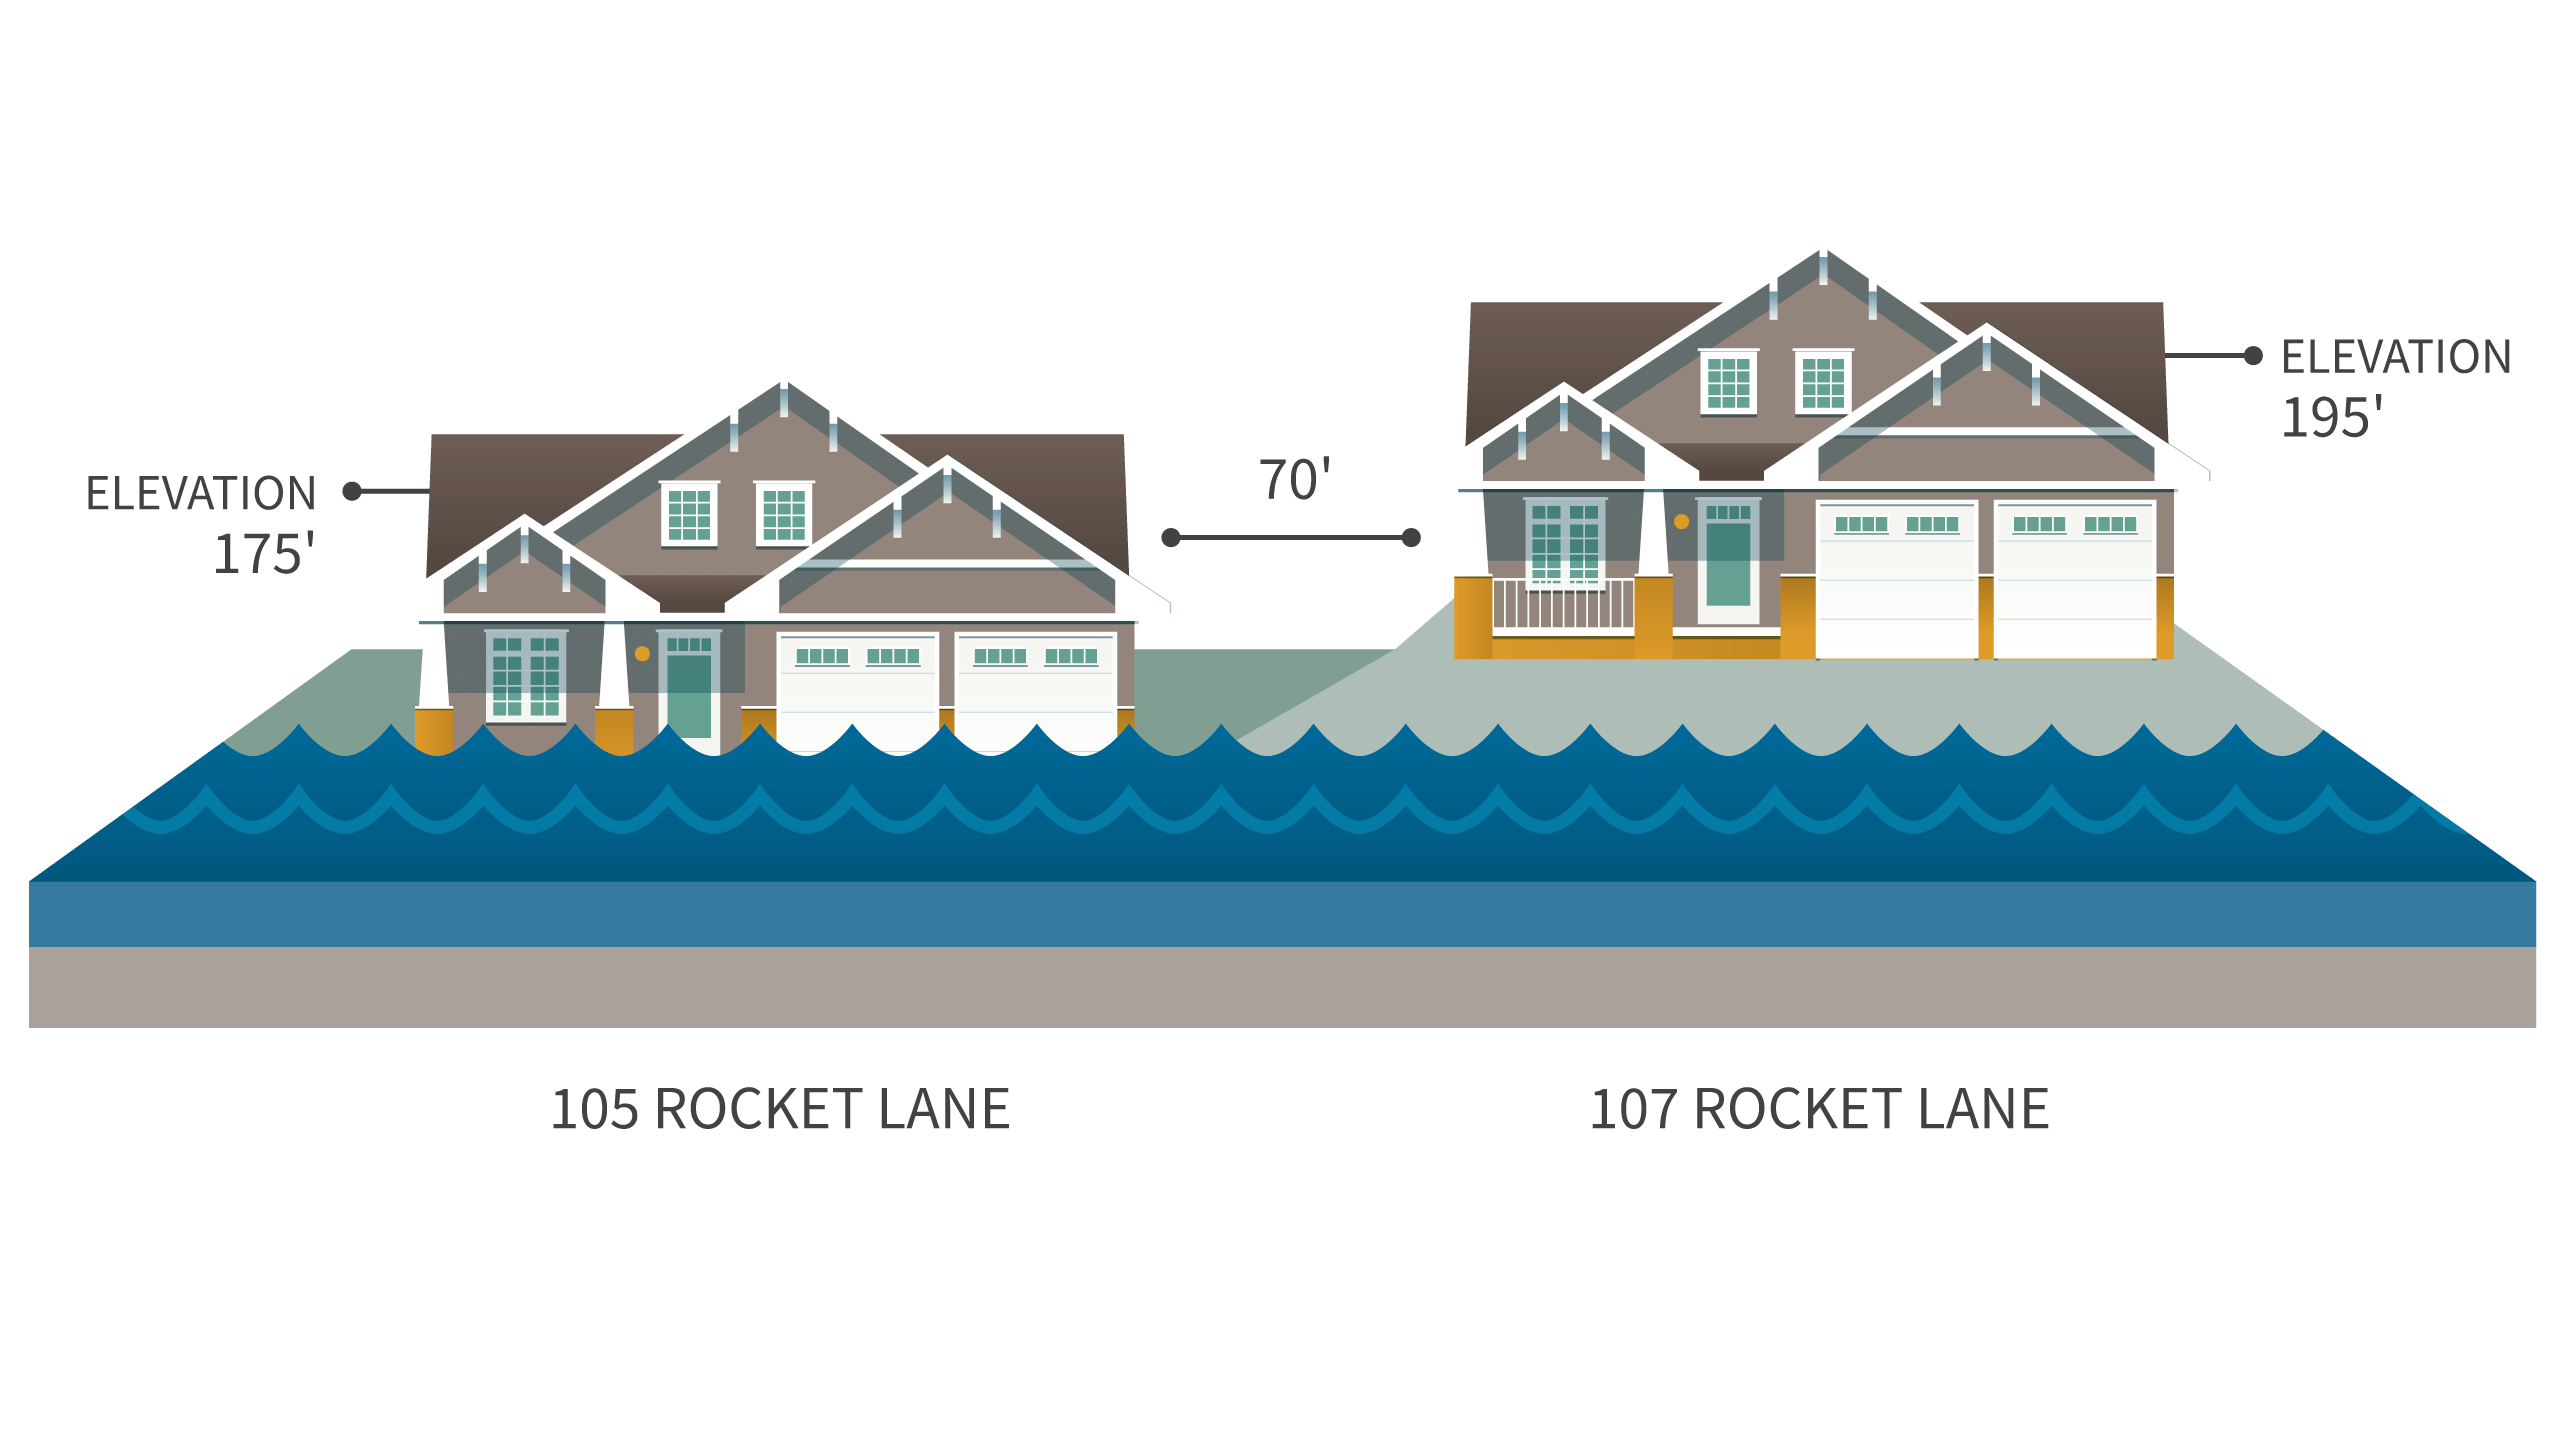
As flood risk evolves due to urbanization and change in baseline stream and sea levels, the flood risk methodology from CoreLogic is designed to stay abreast of the latest risk data and research. Our methodology ensures continuity of risk insights into the future in order to deliver a comprehensive analytic view of the risk.
Our flood models include:
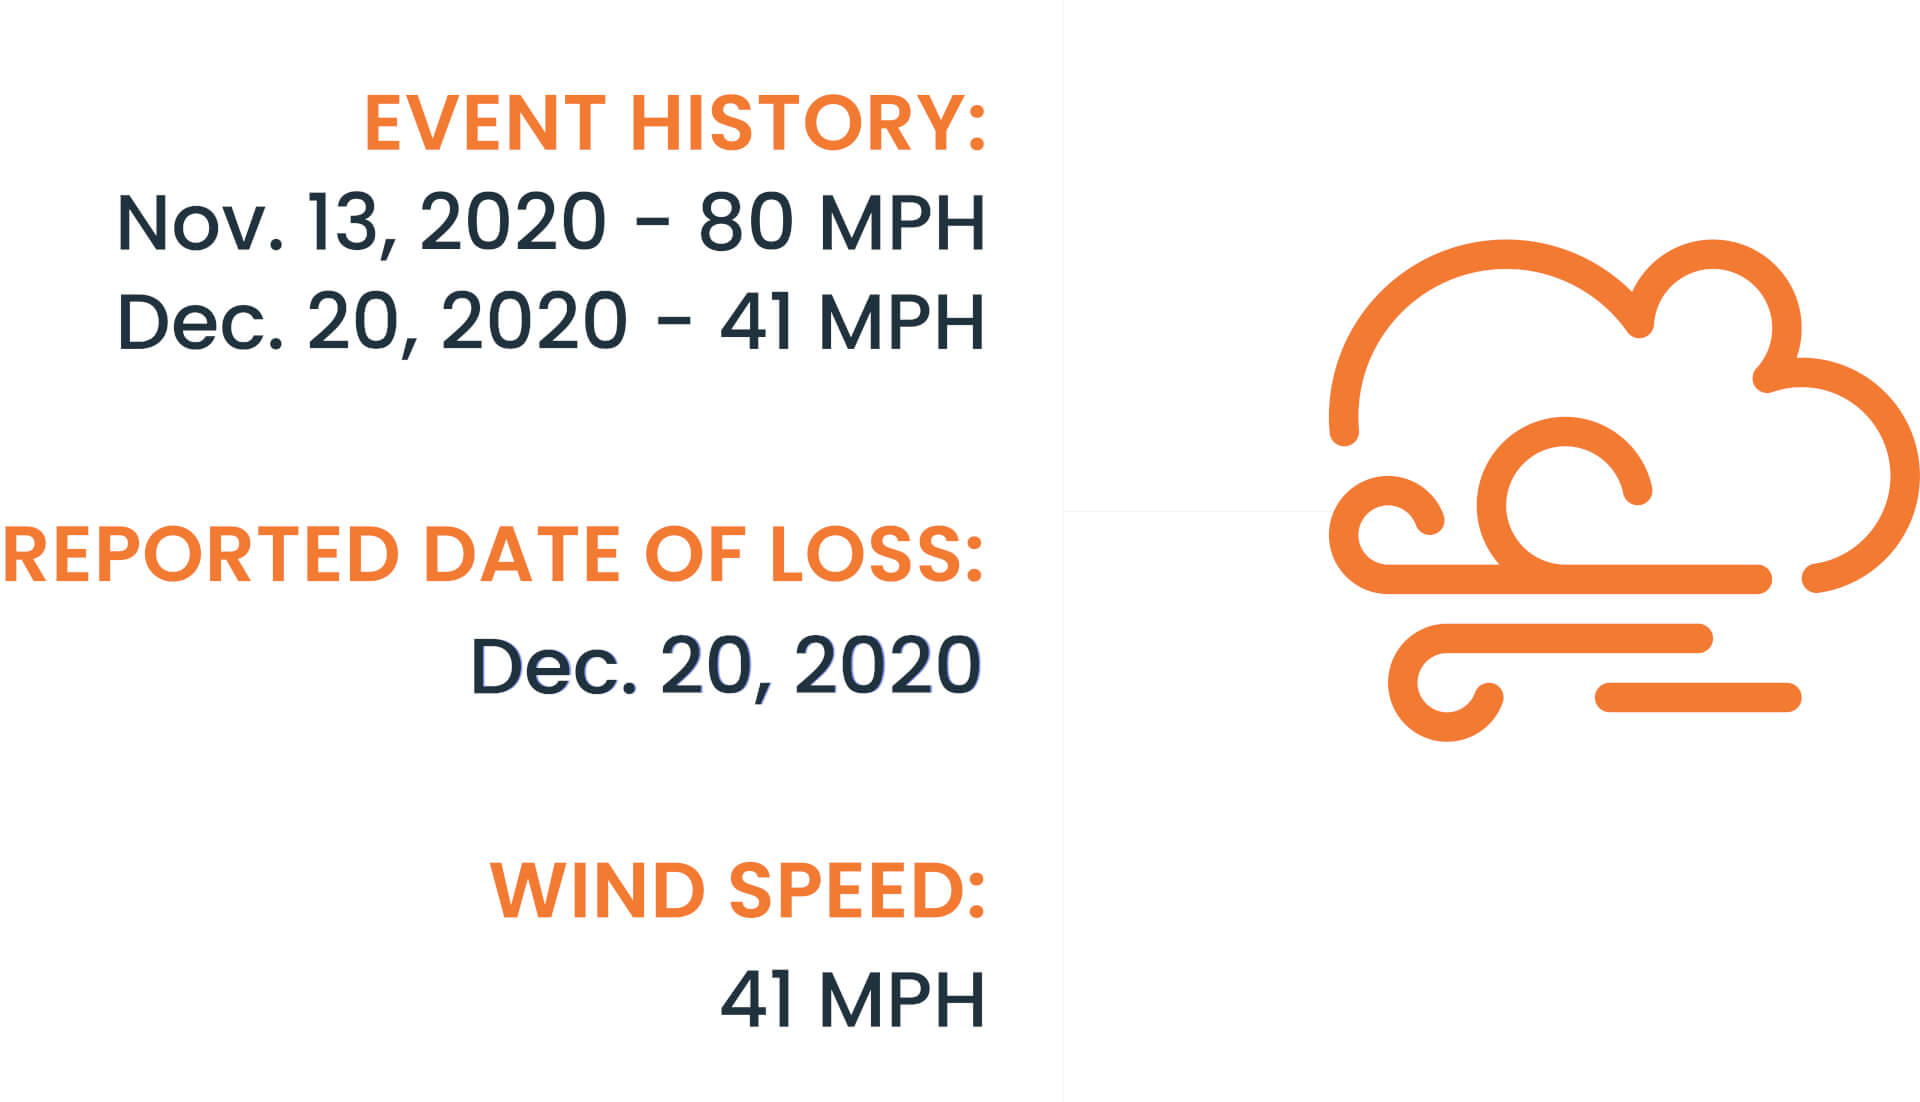
Severe convective storms are among the most common and most damage-inducing natural catastrophes in the United States. The losses from these storms have only increased due to population growth and economic development. CoreLogic’s model provides granular results for better risk differentiation, pricing and managing financial risk from severe convective storms to capture the extreme complexities of the sub-perils—tornadoes, hail and straight-line winds.
Our severe convective storm models include:
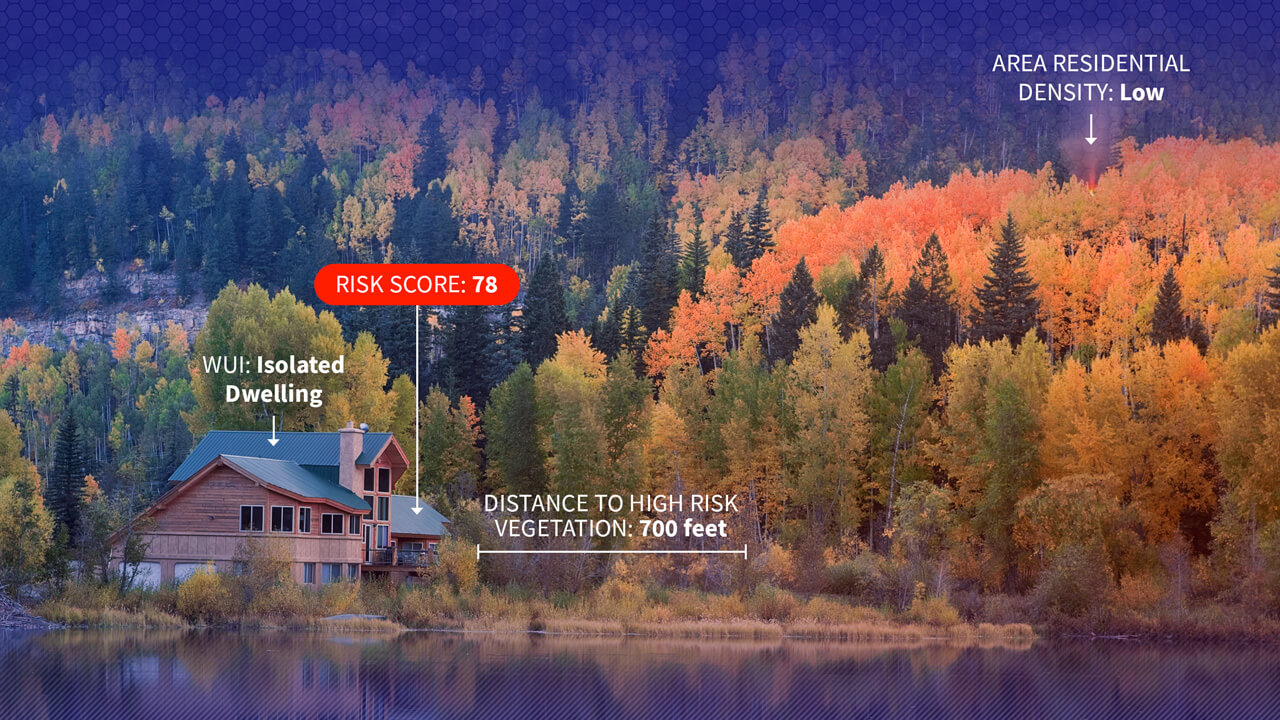
Development sprawl and the increase in vacation properties being built in rural areas are key reasons why this peril has increasing importance to insurers and other stakeholders.
Our wildfire models include:
We know clarity is important amidst the chaos of catastrophic situations—from blazing wildfires to powerful hurricanes battering the coasts—so we want to make sure you’re finding all the information you need to be up to date in one place.
At Hazard HQ™ you’ll find press releases, explanations of how our data works, commentary about what kind of damage we foresee, and critical thinking on what it takes to be more resilient in the face of natural hazards—be it a hurricane, volcano, earthquake, or beyond.
Help your team become everyday heroes by empowering your business with CoreLogic.


